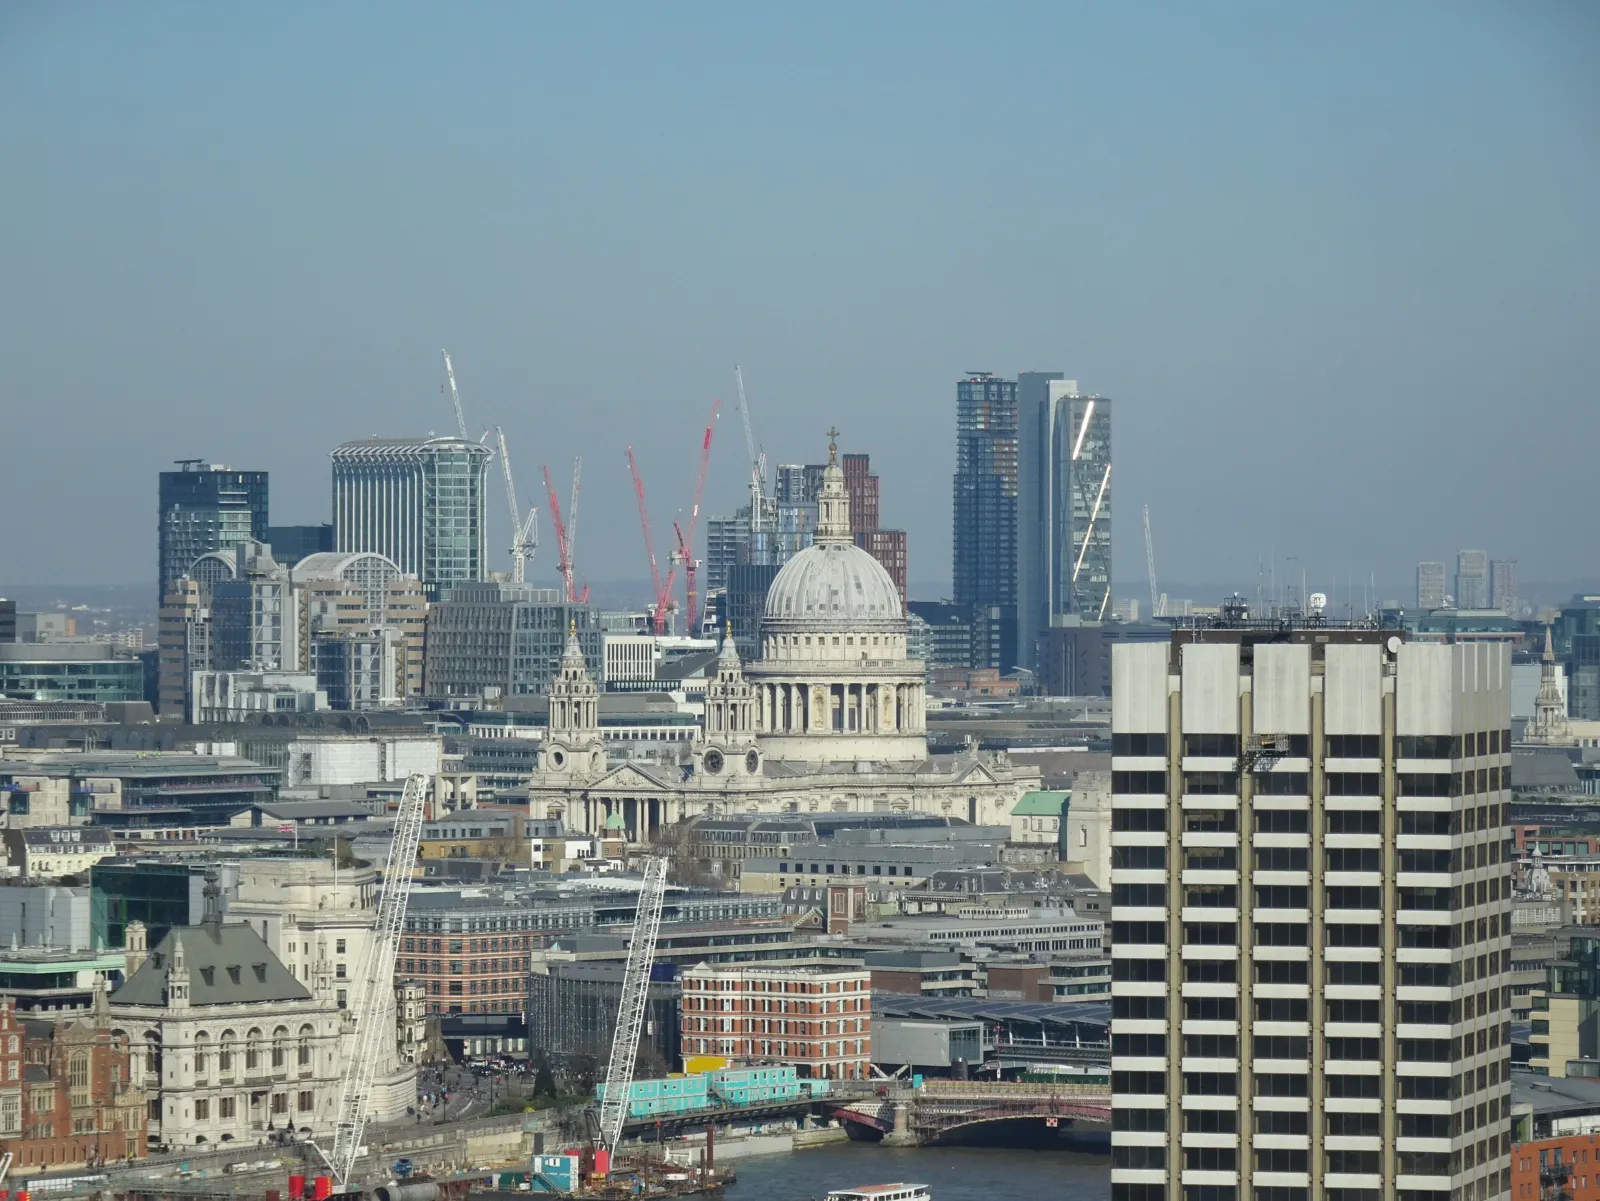
In June 2024, TfL closed Colindale station and knocked most of it down. The 1960s entrance was, by TfL's own assessment, going to reach full capacity by 2026, because the population around it had grown 70% since 2011 and another 11,400 homes were on the way. The station reopened just before Christmas with a bigger ticket hall, step-free access, and a design brief that amounted to: prepare for a lot more people.
Colindale earned that rebuild. Since 2016, planning applications covering more than 14,000 homes have been lodged within 800 metres of the station, roughly a 10-minute walk. That is the highest figure for any station on the TfL network, and schemes covering just under 12,000 of those homes have consent, which squares neatly with TfL's own count of 11,400 on the way. Three schemes account for most of it: Colindale Gardens, the 2,900-home redevelopment of the old Metropolitan Police training centre; Beaufort Park, 2,800 homes on the former RAF aerodrome next door; and Grahame Park, where Notting Hill Genesis is replacing a 1970s estate with more than 3,000 homes, including a 2,088-home phase approved in 2020.
We found that figure by taking every planning application for a major housing scheme in Plota's database of London planning records, 10 homes or more, the planning system's official threshold for "major" development, and matching each one to its nearest Tube, Overground, DLR or Elizabeth line station. More than 16,000 applications since 2016 fall within 800 metres of a station. Counted station by station, they show where London has been planning its homes for the past decade, which lines will carry the results, and where the next decade's homes are (and are not) being planned right now.
The ten stations attracting the most housing
| # | Station | Lines | Homes proposed, 2016-2025 | Of which approved |
|---|---|---|---|---|
| 1 | Colindale | Northern | 14,195 | 11,943 |
| 2 | Wembley Park | Jubilee, Metropolitan | 10,177 | 9,823 |
| 3 | West Croydon | Windrush | 9,494 | 8,861 |
| 4 | Elephant & Castle | Bakerloo, Northern | 9,409 | 7,698 |
| 5 | Southall | Elizabeth | 9,177 | 9,050 |
| 6 | Harrow & Wealdstone | Bakerloo, Lioness | 7,853 | 6,016 |
| 7 | Battersea Power Station | Northern | 7,229 | 7,229 |
| 8 | Pontoon Dock | DLR | 7,195 | 6,966 |
| 9 | North Acton | Central | 6,996 | 6,840 |
| 10 | Stonebridge Park | Bakerloo, Lioness | 6,653 | 6,653 |
Read down the list and a pattern emerges. Elephant & Castle is the only central London entry. Everywhere else is a place with three things: a large industrial or institutional site, planning policy that welcomes density, and a fast line into town. London's new homes are rising on its old factory land. Southall's total sits on its Victorian gasworks, a margarine factory and the Honey Monster's former home. Harrow & Wealdstone's includes the old Kodak works. Pontoon Dock's is almost entirely one scheme, the 6,730-home Silvertown Quays plan for the Royal Docks. West Croydon's 47 schemes include One Lansdowne Road, proposed at 69 storeys and 917 flats, refused, then approved a storey shorter.
One note of caution on reading the ranking: it measures pressure on individual stations, not whole districts. In central London, closely spaced stations divide a neighbourhood's schemes between them; in outer London, one station often absorbs the entire surrounding pipeline. Nine Elms, the development story London talks about most, shows the effect. It appears split across three stations, Battersea Power Station (7,229 homes proposed nearby), Vauxhall (6,302) and Nine Elms (6,260), and combined, the corridor outbuilds everything. Station by station, quieter places like Colindale have been carrying more.
One line is carrying the load
Group the same schemes by line and the leader is the Northern line, with applications covering almost 81,000 homes within 800 metres of its stations over the decade, and the most approved. The development runs the length of the line: Colindale and Edgware in the north, Elephant & Castle, Nine Elms and Battersea in the middle, and the High Path estate by South Wimbledon in the south, where Clarion has an outline application for up to 1,570 homes moving through Merton's planning system right now, part of a 2,800-home rebuilding of the estate.
The Elizabeth line and the DLR follow, and adjusted for the number of stations each line serves, the DLR's compact network is the most development-loaded of all. The gap to the Victoria line, near the bottom with 21,900, says something about how development follows land rather than track capacity. The Victoria line runs through places that were built out a century ago. The Northern line happens to pass through three of London's biggest remaining land reserves, and the Waterloo & City, with no land around either of its two stations, attracted almost nothing.
The Northern line is also home to the clearest recent case of homes paying for track. The Battersea extension, opened in September 2021, cost around £1.1bn, of which £270m comes from developer contributions (more than £200m from the Battersea Power Station site alone) and the rest is being repaid from business rates generated in the area, with no central government money. Four years on, Battersea Power Station station handles 8.5m entries and exits a year, more than long-established stops like Oval, at a station that did not exist in 2020.
What a new railway does to the map
The clearest acceleration in new applications anywhere on the network is at the outer Elizabeth line stations. Across all stations, the pace of major applications has fallen by about a tenth, from roughly 66,000 homes a year in 2016-2021 to 58,000 a year since 2022. At the line's outer ends, it has gone the other way. Around Romford, applications have run at 790 homes a year since 2022, up from 240 a year before that. Maidenhead has more than doubled, from 380 to 870 a year. Acton Main Line, one of the least-used stations on the network in 2019, is up from 230 to 740. TfL's own evaluation of the line, published last year, points the same way: it counted 71,000 homes delivered within a kilometre of Elizabeth line stations since 2015, with the pipeline concentrated around Southall, Acton Main Line, Romford, Stratford and Canary Wharf.
Passengers arrived on the same schedule. Abbey Wood handled 10m entries and exits in 2022, the year the line opened; by 2025 it was 17.9m. Southall has more than tripled against 2019.
Abbey Wood also tops the live pipeline. The biggest scheme with planning activity near any station on the network sits on its doorstep: a consented outline to rebuild the Lesnes estate on the Thamesmead side with up to 1,950 homes, part of Peabody's plan for around 20,000 across the town. And the funding trick from Battersea is being repeated there. In November 2025 the Treasury agreed to lend TfL and the GLA the money for a £1.6bn DLR extension to Thamesmead, justified in large part by the 15,000 homes it is expected to make possible.
Homes follow new track, and once there are enough of them, they start paying for the next piece of it.
Fewer homes are entering the pipeline
That fall in the rate of new applications is one warning about London's future supply. The bigger one comes after permission is granted. Molior counted around 281,000 consented homes in London still unbuilt in late 2025, while just 5,547 private homes started construction that year, down from 33,782 in 2015. In the second quarter of 2025, two thirds of boroughs recorded no starts at all on schemes of more than 20 homes. Planning data can say where homes are proposed and approved. It cannot say when, or whether, they get built.
The live application list makes the same point geographically. The five biggest station pipelines right now are Abbey Wood (2,279 homes), Barking (2,237, most of it a 2,100-home proposal for the town centre lodged in February), South Wimbledon (1,834), Maidenhead (1,512) and Romford (1,112). Every one is at the outer end of a line. Closer in, Elephant & Castle and Vauxhall, two of the defining regeneration stories of the 2010s, have live pipelines of just 700 and 522 homes.
Today's applications are the skyline of 2030. On current evidence that skyline is smaller than the last one, further from the centre, and increasingly gathered around whichever stations got new track most recently. That is probably the right place for it: earlier this year we counted 51 Underground stations being crowd-managed, queued or skipped by trains in the space of three months, and none of today's five biggest pipeline stations is among them. The next Colindale, the data suggests, is already visible: it is at the east end of the Elizabeth line, and its station has at least been built big enough this time.
- Colindale has had more housing proposed around it than any station on the network: applications covering 14,000+ homes within a 10-minute walk since 2016, and consent for almost 12,000 of them. TfL rebuilt the station in 2024 before it hit capacity.
- The top 10 is old industrial land with a fast line into town: Wembley Park, West Croydon, Southall, Harrow & Wealdstone, Pontoon Dock. Elephant & Castle is the only central entry.
- The Northern line carries the biggest pipeline (~81,000 homes proposed near its stations, and the most approved). Per station, the DLR leads. The Victoria line, running through long-built-out neighbourhoods, has the least of any major line.
- Battersea showed homes can pay for track: £270m of the extension's £1.1bn cost came from developers. The £1.6bn DLR extension to Thamesmead, approved in November 2025, repeats the model.
- Fewer homes are entering the pipeline: applications near stations are down about a tenth since 2022, around 281,000 consented London homes remain unbuilt, and the clearest growth left is at the outer Elizabeth line stations.
Planning figures are from Plota, which aggregates and normalises planning applications from council planning portals across London and beyond. Through its API, we took applications proposing 10 or more homes (the statutory definition of major development), geocoded to within an 800-metre straight-line radius of a station. The decade rankings cover applications from 2016 to 2025; "live pipeline" figures describe schemes with applications lodged or updated in the months to July 2026, whatever their stage. Home counts are read from the application descriptions councils publish, so a scheme's figure reflects what its paperwork says rather than what eventually gets built, and the analysis measures the number of homes, not their tenure, affordability or size. Councils file many records per scheme (phases, amendments, conditions), so we counted each site once per station at the largest dwelling figure quoted for it, excluded records geocoded to council-office fallback locations rather than real sites, and manually reviewed the largest schemes at every station in the table, merging records that described the same site under different names. Where an estate was genuinely re-planned years later, both proposals count: totals measure the housing covered by planning proposals, not a tally of distinct consented homes. "Proposed" figures include schemes later refused or withdrawn; "approved" figures count only schemes recorded as permitted, outright or with conditions. The station table covers Greater London; line totals include the Elizabeth line's out-of-London stations. Stations on several lines count towards each line's total, and each scheme counts towards its nearest station only, so in central London, where stations sit close together, a district's development divides between several stations, while an area like Colindale concentrates on one. The rankings measure pressure on individual stations, not whole neighbourhoods.
- Plota - planning application records for 32 London boroughs and surrounding districts, 2016-2026.
- TfL press release, December 2024 - Colindale reopening, capacity forecast, 11,400 homes, population growth.
- TfL, Northern line extension Factsheet I - funding and finance: developer contributions and business rates.
- TfL station footfall data - annual station entry and exit counts used in the ridership chart and figures.
- Centre for Policy Studies / Molior - London construction starts, 2015-2025.
- Molior, Residential Development in London Q3 2025 - unbuilt permissions and construction activity.
- TfL, Elizabeth line post-opening evaluation - homes delivered and pipeline within 1km of stations. TfL's evaluation uses a wider catchment and measures delivered homes and the GLA pipeline, so its totals are not directly comparable with ours.
- GLA, Thamesmead and Abbey Wood Opportunity Area - DLR extension and housing capacity.
- Barnet Council - Grahame Park regeneration; Colindale Gardens (former Peel Centre) consent for 2,900 homes.
- Clarion, High Path regeneration - up to 1,570 homes in outline, within a 2,800-home programme.
- Peabody - Thamesmead regeneration programme.
- Town and Country Planning (Development Management Procedure) (England) Order 2015 - definition of major development.
We build highly customisable tube alerts for the London Underground, Overground, DLR and Elizabeth line. Choose your lines, set your time window, pick your days, and filter by severity. We will only email you when something actually affects your commute.
Set up a free alert →
The Stations That Have Run Out of Room
Three months of TfL data on the 51 stations being crowd-managed, queued or skipped by trains.
Station Usage Explorer
Entry and exit data for every station on the network, year by year.
How Deep Is the Tube?
Data, geology, and the engineering beneath London.
This article is based on planning data to July 2026 and will be updated as schemes progress. Send us a tip if you spot something we should include.