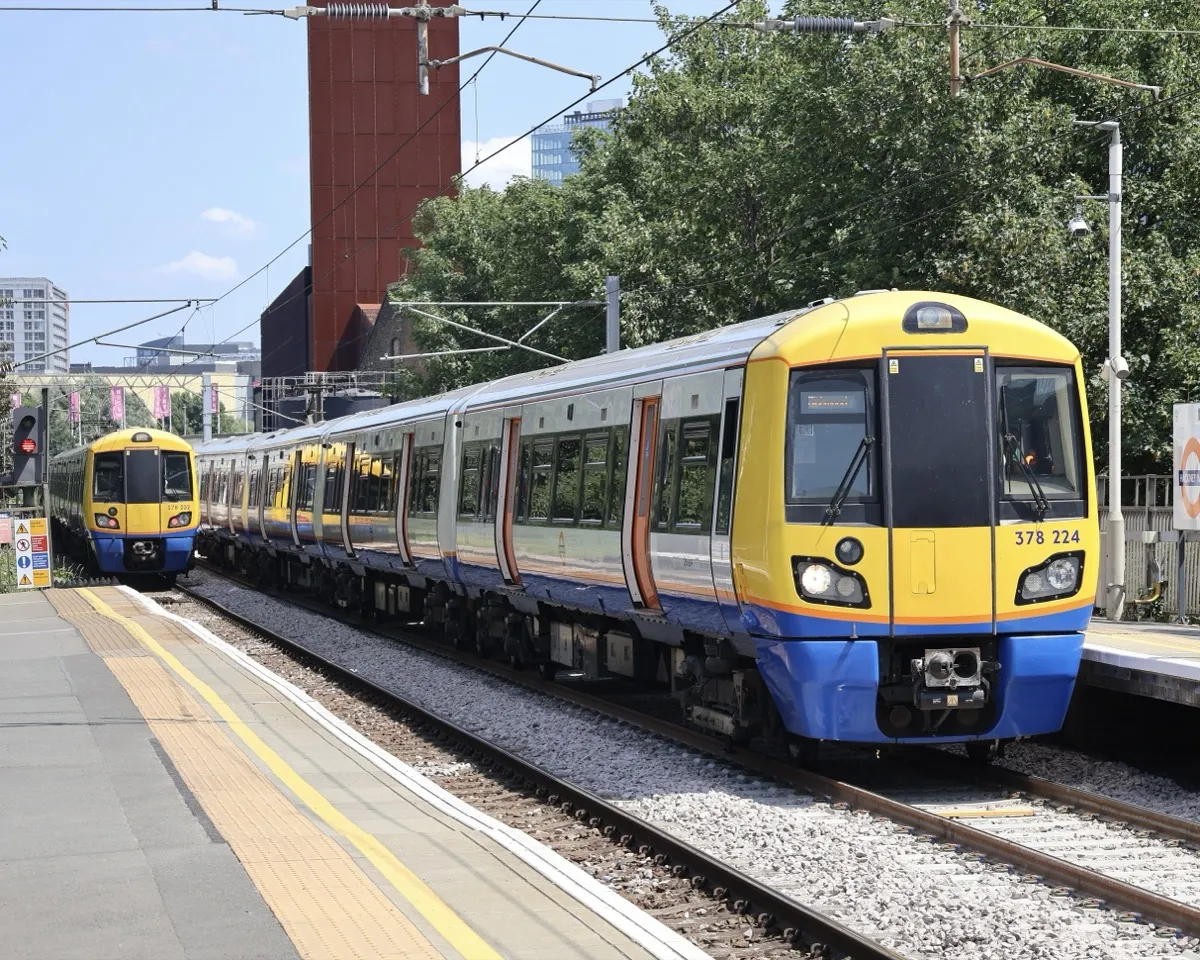
Friday 19 June should have been an unremarkable day on the Mildmay line. TfL's status page showed Good Service when the first trains ran before 5am, Good Service through the morning peak, Good Service at lunchtime and through the evening peak, and Good Service when the last trains wound down after midnight. It did not change once all day. On the railway underneath that banner, 43 trains were cancelled in full or in part. Overhead wire damage took out early services; late-running freight and a crew shortage picked off trains through the middle of the day; and from late afternoon a signalling fault cascaded through the Friday evening peak. Between 18:24 and 19:10, five consecutive Stratford to Clapham Junction services were cancelled outright or cut short mid-route, three of them standing on Stratford's departure boards marked Cancelled; the train before them ran 20 minutes late, having briefly shown as cancelled itself. In total, 27 of the day's cancellations were showing on National Rail's boards before the train was even due to leave. None of it reached the status page.
National Rail had noticed. At 16:36 its official account warned that a signalling fault meant Overground services "may be cancelled, delayed by up to 20 minutes or revised":
ℹ️#ShepherdsBush - A fault with the signalling system between Shepherds Bush and Wembley Central means some lines are blocked. London Overground services may be cancelled, delayed by up to 20 minutes or revised. Southern service will be revised not run between Clapham Junction
— National Rail (@nationalrailenq) June 19, 2026
TfL's status desk was awake too. It marked the neighbouring Lioness line Severe Delays at 16:25, suspended it at 16:33, and kept updating it into the evening. The Mildmay line's status never moved.
Since 27 May we have recorded both sides of the story. Our servers poll National Rail's live departure boards, the same feed that powers the screens at stations, every 90 seconds at peak across 50 London stations: 29 million train observations so far. We have logged every TfL status change for years. Put the two together and one question becomes answerable: when a train was cancelled, what was TfL telling the public at the moment it was due to leave?
The headline numbers
The Mildmay line, which runs from Stratford across north London to Richmond and Clapham Junction, is where the two stories diverge most. Over 46 days we tracked 14,800 Mildmay trains. Of the 9,414 scheduled to depart while TfL was showing Good Service, 882 were cancelled in full or in part.
A status board will always lag a live incident by a few minutes, and if most of these cancellations had been followed shortly afterwards by "Minor Delays", this would be a story about slow updates. They were not. Only 28% of the 882 were followed by a downgrade within the hour. 52% were followed by nothing at all for at least three hours.
The two feeds agree almost everywhere. During periods TfL called Minor Delays, 21% of Mildmay trains were cancelled; during Severe Delays, 40%; Part Suspended, 61%; a full suspension, 94%. The disagreement is confined to the bottom of the scale, under the one label that requires admitting nothing.
It happened on 42 of the 46 days we measured, averaging 19 hidden cancellations a day. The worst single day, 19 June, saw 43 trains cancelled under Good Service; 29 May saw 40; four other days topped 37.
The evening peak is when it is worst
In the morning peak, 7.5% of trains due to depart under Good Service were cancelled. Between 4pm and 8pm it was 13.3%, one train in seven, and the 7pm hour alone hit 18.7%, nearly one in five. The status board is least honest at exactly the moment the most people are standing on its platforms.
What a cancellation does on the Overground
TfL might reasonably respond that a status board describes the service as a whole, not individual trains, and that a single cancellation on a frequent line does not amount to delays. The Mildmay line is genuinely frequent: a train is scheduled roughly every 12 minutes on each branch, and every 6 to 7 minutes on the core between Stratford and Willesden Junction where the branches overlap. Lose one train and the branch gap stretches to around 25 minutes; annoying, but arguably survivable without a status change.
What the data shows is pile-ups. On 34 of our 46 days, we recorded consecutive trains on the same route, back to back, both cancelled while Good Service showed at their departure times and neither reinstated; it happened 218 times in six weeks. In the clean cases, where the trains either side of such a pair ran, the median gap left in the timetable was 44 minutes, nearly four times the advertised wait, on a railway whose entire pitch is that you do not need a timetable. And the streaks go deeper than pairs: on 14 occasions, five or more consecutive trains on one route stayed cancelled in full or in part under Good Service, including the five Clapham Junction services on the evening of 19 June that opened this article.
Take every train that ran on the Richmond and Clapham Junction branches and the scheduled waits between them. During periods TfL admitted Minor Delays, one gap in five stretched past half an hour; under Good Service it was one in 26. But the line spends most of its life under Good Service, so the absolute counts invert: Good Service periods produced 294 gaps of 30 minutes or more, twice as many as Minor Delays did, 80 of at least three-quarters of an hour, and 26 of an hour or more. The longest reached 95 minutes, on the morning of 8 June between Stratford and Richmond; TfL acknowledged a problem 73 minutes in. On the evening of 19 June, the Clapham Junction service came down to one late-running train in 84 minutes, Good Service throughout. Some of the longest waits of the six weeks happened under the line's best label.
The packed train 25 minutes after a cancellation is the double gap arriving. The train that runs through your station without stopping, sometimes visibly empty, is often a short-turned service being repositioned to patch the timetable further up the line: 646 of the 882 Good Service cancellations were partial, meaning the train was cancelled at some of the stations we watch but not others. Only 236 vanished entirely. A part-cancelled train still runs somewhere, which may be exactly why it never troubles the status board, but if it was your stretch of the line that got cut, the distinction is academic.
The stretch that got cut most often was the busiest one. 57% of the hidden cancellations took out the Stratford end of the route, the core section every Mildmay train shares through Hackney, Canonbury, Highbury & Islington and Camden Road. In the 7pm hour, one scheduled train in nine through those stations vanished while the status showed Good Service.
Why the Mildmay line specifically
National Rail publishes a reason alongside each cancelled train. Together they explain a lot about this line.
Two entries on that list would look strange to a Tube rider. "Late-running freight" cancelled 57 passenger trains during Good Service. The North London Line belongs to Network Rail, and it is one of Britain's busiest freight corridors: much of the container traffic from Felixstowe and the Thames ports to the Midlands crosses London here, threaded between four-car passenger trains. When a 750-metre intermodal service loses its slot, the passenger timetable pays. TfL runs the service through a concessionaire, FirstGroup's First Rail London, which took over from Arriva three weeks before our measurement began, on track it does not control, shared with trains it does not schedule.
The rest of the list is more prosaic and more damning: train faults, repair queues, driver shortage and delayed crew accounted for 278 between them. That is fleet availability and rostering, the things investment buys. June's overhead wire damage in the heat added 60 more. Most of it never changed what the status page said.
What it takes to move the status
TfL does not publish the threshold at which cancellations become "Minor Delays". The data lets us reverse-engineer it. Group every Mildmay cancellation in our six weeks into episodes, clusters separated by at least an hour of clean running, and there were 181 of them. We counted an episode as acknowledged if the status showed anything other than Good Service at any point during it or in the 45 minutes after. 67 of the 181 passed that test.
Episodes of ten or more cancellations were acknowledged 83% of the time; five to nine, 42%; a pair of cancellations, 22%. Four in five episodes lasting over three hours were acknowledged, against one in five of those under an hour. And disruption touching both branches was acknowledged 69% of the time, against 24% for disruption confined to one branch.
Every weather episode changed the status. Signalling failures, Network Rail's responsibility, changed it 72% of the time. Faults on TfL's own trains, the single most common cause, changed it 22% of the time, and even among episodes the same size as the weather ones the rate only reached 39%. Congestion managed 10%. On this evidence the threshold is selective: disruption gets admitted most readily when someone else is to blame.
TfL has written down what these words are supposed to mean. Its public definitions page says Good Service means "we are running as advertised". An internal Underground rulebook, written in 2017 and disclosed under Freedom of Information, sets numeric triggers: on the Central line's outer sections, more than three consecutive cancellations mean Severe Delays at any time of day, with lower bars elsewhere, down to a single cancelled train on the quietest stretch. Even the most forgiving rule in the document, for Central line branches on the Night Tube, stops calling a 39-minute gap Good Service. The document may have been revised since; TfL has not published a successor.
TfL has published no equivalent for the Overground. But judge our six weeks by the Tube's own thresholds and the 218 back-to-back cancellations were each at least a Minor Delays event, the 14 streaks of five or more were Severe, and the 95-minute gap sat in what the rulebook calls Suspended territory. The Mildmay line was plainly not being judged by these thresholds. Whatever rules TfL applies to the Overground, they permit disruption that its Underground guidance would classify as Minor, Severe, or even Suspended.
The Mildmay line is the outlier. Here is the same measurement for every Overground line our station coverage can see.
The Weaver and Liberty lines show that near-zero is achievable: they are self-contained railways with little freight and simple service patterns, and their boards and their trains agree with each other. The Windrush line's 3.1% is understated, since we only see its Clapham Junction branch, but it points the same direction. The Mildmay line's 9.4% is the price of this particular railway: shared, congested, freight-heavy track, a fleet and crew pool the cancellation reasons suggest are stretched thin, and a status feed that admits none of it.
Where the Mildmay line would really sit
Our network dashboard has scored every line for years by a simple, TfL-friendly measure: the share of operating hours the line's own status feed showed Good Service. Over the last 12 months the Mildmay line scores 71.2% on that measure, 16th of the 20 lines we track. Mid-lower table; unremarkable.
But that score takes TfL's word for it. Our train-level data lets us correct it. During our six-week window, the Mildmay line showed Good Service for 595 operating hours. 340 of them, 57%, contained at least one cancelled train; 198 contained two or more; 156 contained a train cancelled at every station we watch. How far the score falls depends on how harshly you reclassify those hours. Count every hour with any cancellation as disrupted and the corrected 12-month figure lands around 30%. Count only the hours with a fully cancelled train, the most conservative version, and it lands around 52%. Every version puts the Mildmay line last, below the Piccadilly's 58.2%.
Even at the conservative end, and allowing that our window was a hot, bad six weeks and that the Underground lines above it carry uncorrected statuses of their own, the conclusion survives: judged by the trains that ran rather than the label overhead, the Mildmay line is plausibly the least reliable railway TfL operates.
What TfL should do about it
Nobody at TfL is inventing numbers. The status feed is an editorial product with thresholds, and cancellations that do not produce sustained long gaps evidently do not meet them. Those thresholds, which TfL does not publish, are set so high, and applied so selectively, that hundreds of cancelled trains a month never register in the only reliability signal most passengers see. A rider deciding between the Mildmay line and the bus deserves to know that one train in eleven is not serving its full scheduled route, one in seven in the evening peak. Nothing TfL shows them says so.
Three things would fix it, and none is hard:
Publish cancellation counts per line, per day. The data exists; every cancellation in this article came from a public feed. TfL reports Overground performance to its own board and the rail regulator publishes operator-level cancellation scores, but neither is on the status page where passengers look. A daily cancellation count next to each line's status would close the gap between the board and the platform at almost no cost.
Publish the thresholds. If "Minor Delays" requires a certain level of disruption, say what it is. Passengers can adjust to a rule they can see; they cannot adjust to a judgement made in private.
Let the status reflect short-notice cancellations at all. A day with 43 cancelled trains, 27 of them showing on the departure boards before departure, should be mechanically incapable of ending with an unchanged Good Service banner. The feed needed to trigger that change is already available through the same railway data used by departure boards and journey planners.
There is a bigger reason to want honest numbers. The Mildmay line's problems, shared freight track, overhead line renewals, fleet availability, are investment problems, and several are Network Rail's and the government's to fund rather than TfL's. The case for that money is made with evidence of failure.
"Cancelled in full or in part" means the train was shown as cancelled at one or more of the stations where we observe the line; 646 of the 882 Good Service cancellations were partial (the train ran on some stretch of its route), and 236 were cancelled at every station we watch. We observe Mildmay trains at Stratford, Richmond and Clapham Junction, which between them see almost every service on the line. "During Good Service" means TfL's status feed showed Good Service at the train's scheduled departure time from its origin, so a train cancelled during an acknowledged incident, or after TfL had downgraded the status, does not count, and trains during planned closures are excluded because the status shows the closure. Our status log is near-continuous but polled, so a small number of trains could sit within a minute or two of a status change. Six weeks is a meaningful sample but a summer one: it includes June's exceptional heat, which inflated overhead-line failures, and no leaf-fall season. The National Rail feed is the same Darwin system that drives the physical departure boards and journey apps, so at minimum it is what passengers were being told, whatever the wheels were doing. Its cancellations are persistent rather than glitchy (the cancelled 18:46 from Stratford on 19 June showed Cancelled on every one of our polls for the half hour before departure), and they climb in lockstep with TfL's own admissions, reaching 94% of trains during declared suspensions. In about 6% of cases a train marked cancelled at a station is later reinstated; the headline figure counts those, because riders saw them cancelled, but recounting with only trains whose cancellation stood at departure gives 8.9% rather than 9.4%, one train in eleven either way. The gap, pair and streak figures in this article all use that stricter basis: a reinstated train counts as running. We will keep measuring.
- One Mildmay train in 11 was cancelled in full or in part despite Good Service showing at its scheduled departure time: 882 of 9,414 trains over 46 days, on 42 of the 46 days.
- The evening peak was worse: one train in seven between 4pm and 8pm, and nearly one in five in the 7pm hour.
- 52% of those cancellations were never followed by any status downgrade within three hours.
- By TfL's own internal Underground thresholds, much of this was Minor or Severe Delays, and the longest gaps sat in Suspended territory. Whatever rules the Overground status follows, they are not those.
Sources & methodology
Train-level data comes from National Rail's Live Departure Boards Web Service (LDBWS), accessed via the Rail Data Marketplace, the same feed that powers station departure screens. Between 27 May and 11 July 2026 we polled the boards of 50 London stations every 90 seconds at peak times and every 5 minutes off-peak, recording 29 million train observations. Each observation carries the operator, origin, destination, scheduled times, live status and, where published, the reason for delay or cancellation. We stitch observations into individual train journeys, so a train seen at several stations is counted once. Mildmay line trains are identified as London Overground services running between Stratford, Richmond, Clapham Junction, Willesden Junction, Camden Road and Shepherd's Bush, observed at the Stratford, Richmond and Clapham Junction boards; other Overground lines are identified by their origin-destination pairs the same way. A train counts as cancelled if the National Rail feed marked it cancelled at any station we observe, which includes part-cancellations and short-turns; the split between full and partial cancellations is given in the article. TfL status comes from our continuous log of the TfL Unified API line status feed, which we have recorded for several years. A train is counted as cancelled "during Good Service" if the line's most recent status at its scheduled origin departure time was Good Service; trains cancelled after TfL had downgraded the status therefore do not count, and trains during planned closures are excluded by construction because the status shows the closure. Where the article cites specific incidents (such as 19 June), we verified the full status timeline for that day by hand, checked whether each cancellation appeared on the boards before or after the train's scheduled departure, and checked at which stations the train was shown as cancelled; "cancelled outright" in the 19 June account means the train was marked Cancelled on its origin station's own departure board. Peak buckets use scheduled departure time; scheduled frequency figures are derived from the same timetable data. Service gaps, back-to-back pairs and consecutive streaks treat a train as cancelled only if its cancellation was still in force at its last observation (trains briefly shown as cancelled and then reinstated count as running); gaps are measured between the scheduled departure times of consecutive running trains on the same route, assigned to the TfL status showing at the gap's midpoint, and the median gap for back-to-back cancellations is measured across the 72 cases where exactly two consecutive trains stayed cancelled during Good Service and the trains immediately before and after both ran. Headline cancellation counts include reinstated trains, with the stricter figure given alongside. A cancellation counts as taking out the core section if the train's cancellation stood at the Stratford board, which every core-section service reaches. Episodes group all cancellations (whatever the status at the time) separated by less than an hour; an episode counts as acknowledged if any status other than Good Service showed at any point from 15 minutes before its first cancelled departure to 45 minutes after its last, a test that is generous to TfL; causes use the reason National Rail published for the majority of the episode's cancellations. League-table figures use our network dashboard's long-standing measure, the share of operating hours (excluding planned closures) that each line's TfL status showed Good Service; the corrected Mildmay figure reclassifies Good Service hours containing cancelled trains as disrupted at the rate observed in the measurement window, quoted as a range from the strictest test (any cancellation in the hour) to the most lenient (only hours containing a fully cancelled train). The Suffragette line (Gospel Oak to Barking Riverside) does not call at any station we poll and is excluded; the Windrush figure covers its Clapham Junction branch only.
- Rail Data Marketplace - National Rail Live Departure Boards (LDBWS) feed, train-level running and cancellation data.
- TfL Unified API - line status feed, logged continuously by Tube Alerter since 2023.
- Tube Alerter network dashboard - 12-month reliability league table for all lines.
- TfL, status definitions - public definitions of Good Service ("we are running as advertised"), Minor Delays, Severe Delays and Suspended.
- TfL FOI-1077-1920, Central and Jubilee line service status definitions - internal thresholds for declaring Minor Delays, Severe Delays and suspensions on the Underground, including consecutive-cancellation and percentage-of-service triggers (document version 4.3, dated 22 August 2017, disclosed 2019-20).
- Office of Rail and Road data portal - official operator-level punctuality and cancellation statistics, published quarterly.
- TfL, London Overground - line information; the Overground is operated for TfL by First Rail London (FirstGroup), which took over the concession from Arriva Rail London on 3 May 2026, on Network Rail infrastructure.
- Network Rail, rail freight - background on freight operations on the shared network, including the cross-London corridors used by Felixstowe and Thames port traffic.
We build highly customisable tube alerts for the London Underground, Overground, DLR and Elizabeth line. Choose your lines, set your time window, pick your days, and filter by severity. We will only email you when something actually affects your commute.
Set up a free alert →
Week-Long TfL Lift Outages
We tracked 567 TfL lifts for 80 days and found 45 outages lasting more than a week.

The Stations That Have Run Out of Room
Three months of TfL data on the 51 stations being crowd-managed, queued or skipped by trains.
TfL's £190m Fare Evasion Estimate
The figure carries a 10 per cent confidence cut TfL has never published.
This article is based on data collected between 27 May and 11 July 2026, and the collection is ongoing. We will revisit these figures with a full quarter of data, including the autumn leaf-fall season. Send us a tip if you work on the railway and can add context we are missing.